

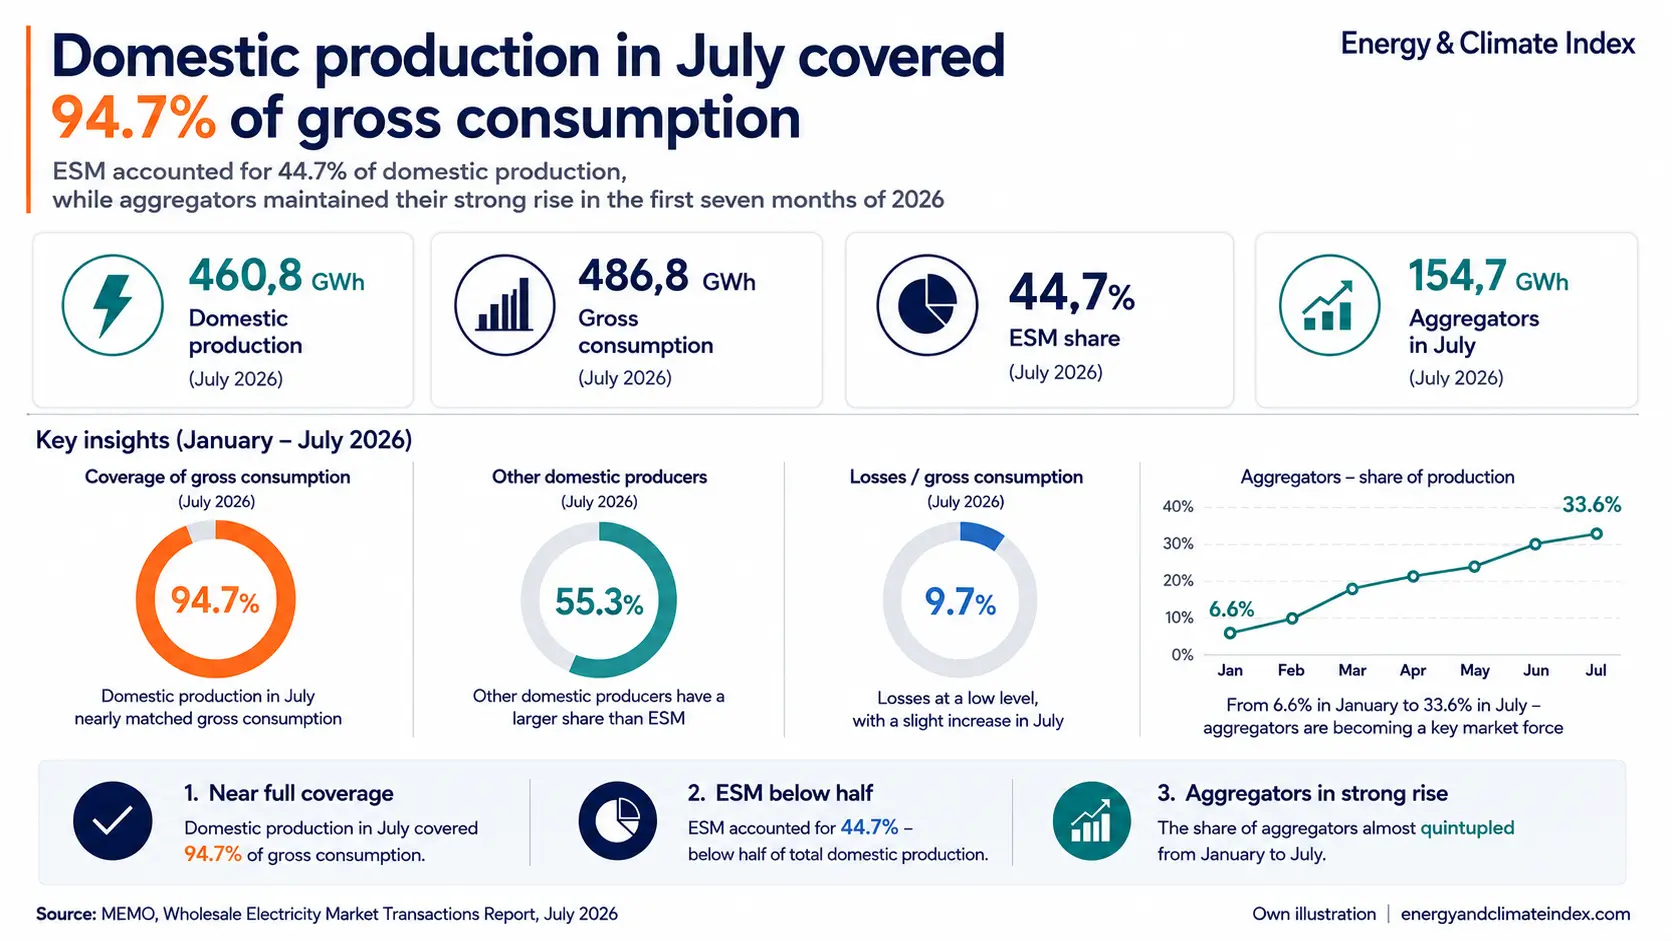
ESM accounted for 44.7% of domestic electricity production in July, while all other domestic producers combined reached 55.3%. At the same time, aggregators maintained their strong upward trend and remained the most dynamic segment of the market in the first seven months of 2026.
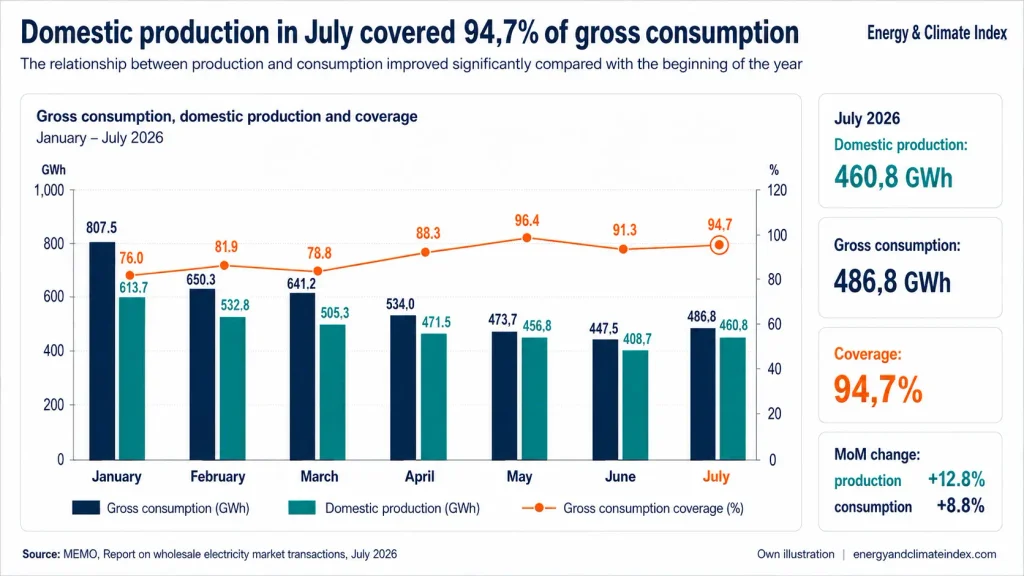
Domestic electricity production in July 2026 amounted to 460.8 GWh, while gross consumption reached 486.8 GWh, according to data from MEMO, the electricity market operator. This means that domestic production covered 94.7% of gross consumption in July, leaving a gap of around 26 GWh between the two categories.
Compared with June, domestic production increased by 12.8% in July, while gross consumption rose by 8.8%. As a result, July recorded a better balance between domestic production and overall consumption than June, when the coverage ratio stood at 91.3%.


More than half of July production came from producers outside ESM
Of the total 460.8 GWh of domestic electricity production in July, ESM accounted for 205.9 GWh, or 44.7%. The remaining 254.9 GWh, or 55.3%, came from other domestic producers.
Within this group:
- aggregators accounted for 154.7 GWh;
- independent producers for 70.8 GWh;
- feed-in tariff producers for 29.5 GWh.
In other words, although ESM recorded a monthly increase of 21.6% in July compared with June, its share of total domestic production remained below 50%, while producers outside ESM collectively maintained a majority share.
ESM’s share is lower than in January, while aggregators are the fastest-growing segment
Data for the January–July period show that ESM’s share of domestic production fluctuated, but was generally lower than at the beginning of the year.
This means that despite a partial recovery in July compared with June, ESM’s share remained almost 10 percentage points below its January level.
The strongest trend, however, came from aggregators. The volume of electricity marketed through aggregators increased from 40.5 GWh in January to 154.7 GWh in July, representing growth of around 282%.
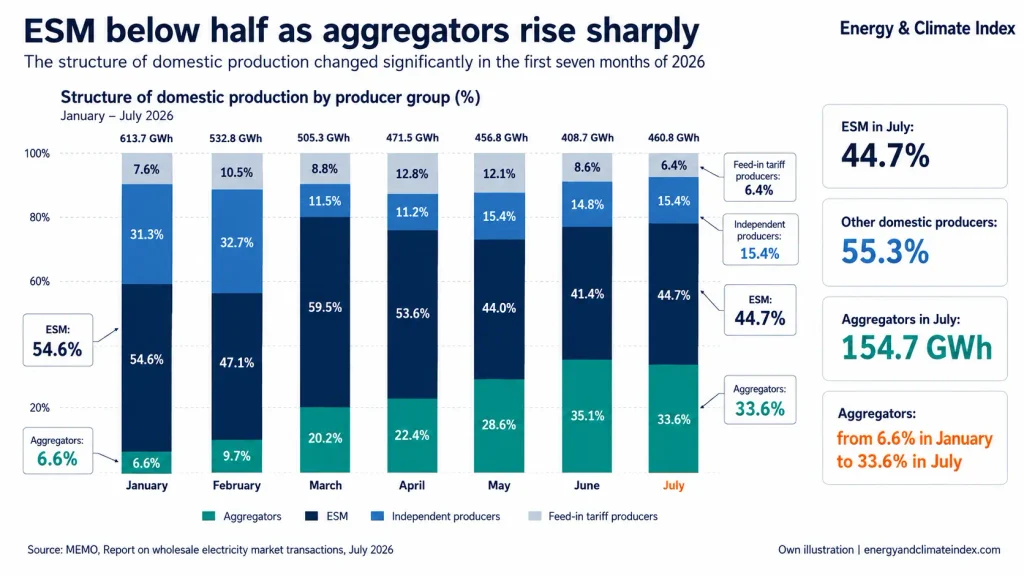
Although their share declined slightly in July compared with June, aggregators remained far above the levels seen at the beginning of the year and continued to be a key driver of the changing structure of domestic electricity production.
During the winter months, ESM has a larger share, when photovoltaic generation is significantly lower and a greater portion of electricity demand is met by thermal and hydropower plants.
As solar generation increases during the spring and summer months, the volume of electricity marketed through aggregators also rises. Aggregators bring together a larger number of producers connected to the distribution network. This is clearly reflected in the increase from 40.5 GWh in January to 154.7 GWh in July, while their share of domestic production rose from 6.6% to 33.6%.
Grid losses remain below levels seen at the start of the year, but July brought a slight reversal
Total transmission and distribution grid losses amounted to 47.3 GWh in July. This was higher than the 40.8 GWh recorded in June, representing a monthly increase of 15.9%.
However, when losses are measured as a share of gross consumption, the trend in 2026 still shows a significant decline compared with the beginning of the year.
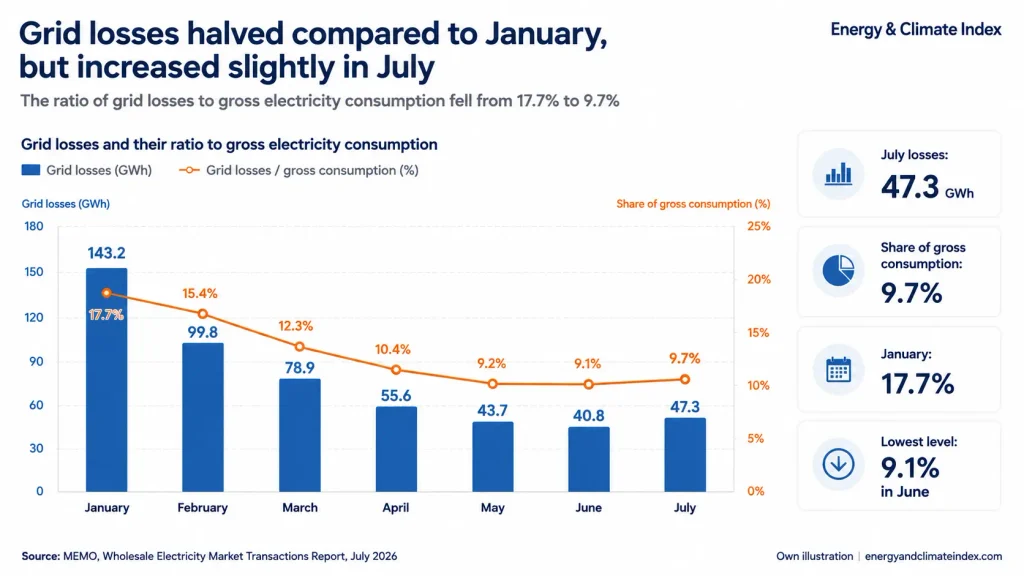
July therefore brought a slight increase in grid losses as a share of gross consumption, but the level remained significantly below that recorded in the first quarter.
What July shows
Data from the first seven months of 2026 indicate that the change in the structure of domestic electricity production is not merely a monthly fluctuation, but an increasingly pronounced seasonal and structural trend.
This trend is likely to become even more visible as new photovoltaic capacity is connected to the system and investment in battery energy storage systems continues. Batteries will allow part of the solar electricity generated during peak production hours to be stored and delivered later in the day, increasing the market value of these assets and strengthening their role in meeting electricity demand.
As a result, the second and particularly the third quarter of the year could increasingly be characterised by a higher relative share of electricity marketed through aggregators and a lower share of ESM in total domestic production. This does not necessarily mean that ESM will produce less electricity in absolute terms every month, but rather that as new renewable and battery capacity expands, its relative share within an increasingly diversified production structure is likely to gradually decline.
ECI